StoryGraph vs Printable Reading Log: Which Should You Use?
StoryGraph and a printable reading log both track your books well, but they suit different readers. StoryGraph is a free app that automatically charts your pace, moods, and genres, while a free printable reading log is a no-account paper sheet you fully control, ideal for privacy, kids, and offline simplicity. Pick StoryGraph if you love automatic stats; pick a printable log if you want total control with zero screens.
Want to try the paper route in a minute? Open the free reading log maker, choose your columns, and print a clean sheet you own outright. No sign-up, no data sharing, no app to update.
The Short Answer
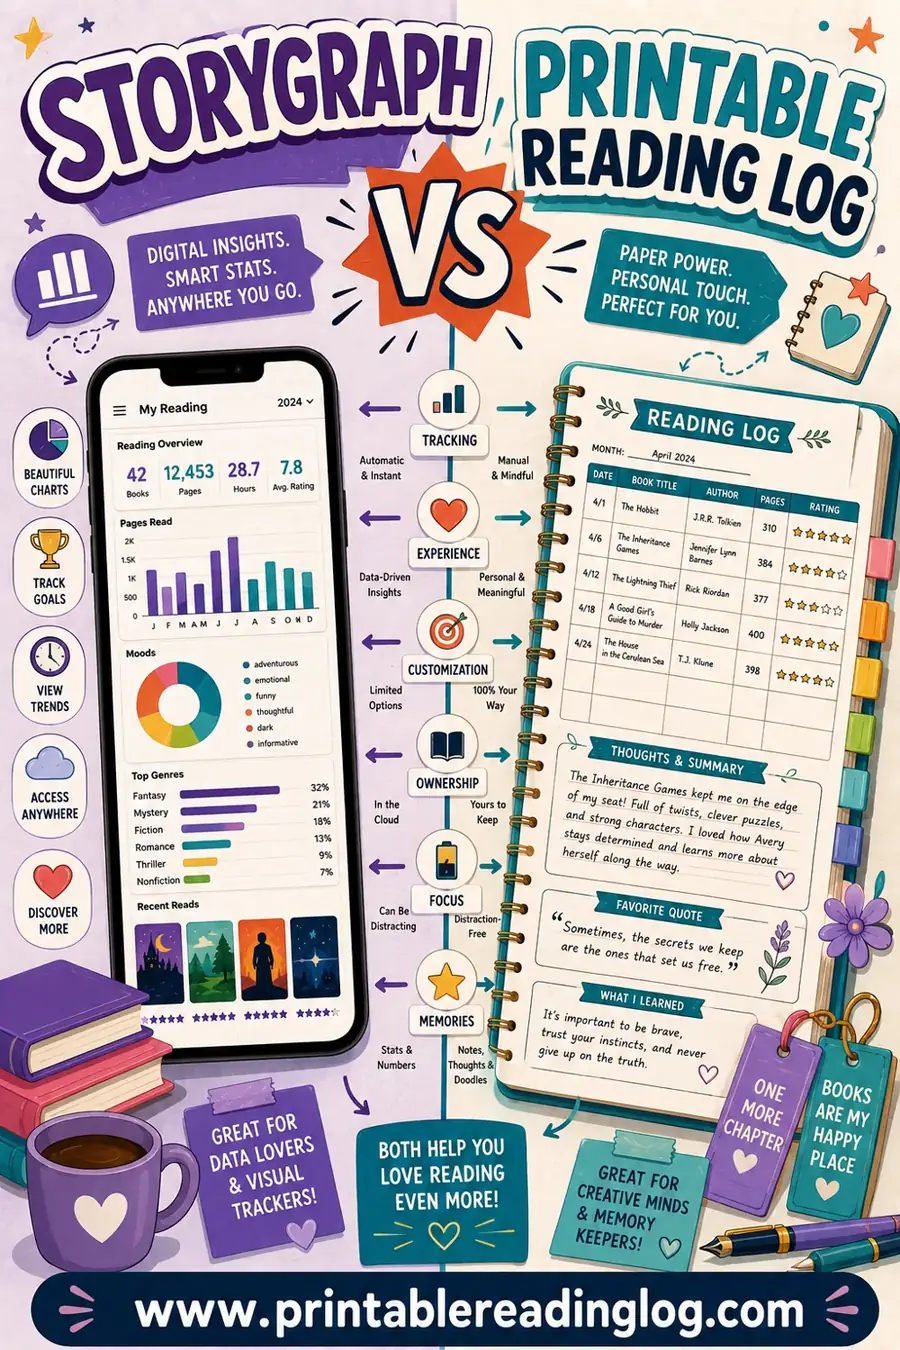
These two tools solve the same problem in opposite ways. StoryGraph does the thinking for you: log a book and it produces charts, stats, and recommendations. A printable log puts you in charge: you decide every column and write each entry by hand, which keeps it simple, private, and screen-free.
Neither is "better." The right choice depends on whether you want automation or control. Many readers, honestly, use both, and we'll show you how at the end.
StoryGraph vs Printable Reading Log at a Glance
Here's the head-to-head, so you can see where each tool shines.
| Feature | StoryGraph | Printable reading log |
|---|---|---|
| Cost | Free, with paid Plus tier | Free, always |
| Account needed | Yes | No |
| Automatic stats | Yes (pace, moods, genres) | No (you tally by hand) |
| Works offline | Limited | Always |
| Good for kids | Not really | Excellent |
| Privacy | Data on their servers | Stays on paper |
| Customization | App's layout | Any columns you want |
| Recommendations | Yes | No |
The pattern is clear: StoryGraph wins on automation and discovery, while the printable log wins on simplicity, privacy, and flexibility. Where you land depends on which column matters more to you.
When StoryGraph Is the Better Choice
StoryGraph is genuinely excellent, and it's the right pick in several cases.
- You love data. If you enjoy seeing your reading pace, mood trends, and genre balance charted automatically, StoryGraph is a joy.
- You want recommendations. It suggests your next read based on what you've enjoyed.
- You're migrating from Goodreads. It imports your library in a few clicks, so you don't lose your history.
- You read mostly on a phone or e-reader. Logging in the same place you read is convenient.
If those sound like you, StoryGraph's free tier is a fantastic, no-cost upgrade over a basic tracker. We're not here to talk you out of it.
A note on the paid tier
StoryGraph's core features are free. A low-cost "Plus" subscription unlocks deeper stats and challenge tools. For most readers the free tier is plenty, but it's worth knowing the upsell exists if you want the full dashboard.
When a Printable Reading Log Wins
A printable reading log beats an app in situations StoryGraph simply wasn't built for.
- For kids. A six-year-old shouldn't be logging reading on a phone. A paper log with big rows, a signature line, and a sticker spot is far better, and it satisfies the nightly-reading homework teachers assign.
- For privacy. Your reading history stays on paper in your home, not on a company server. Some readers really value that.
- For offline reliability. A sheet on the nightstand never loses signal, runs out of battery, or hides behind an update.
- For total control. Want a "favorite quote" line, a re-read column, or a mood doodle box? Add it. The app gives you its layout; paper gives you yours.
- For a screen break. If you read partly to get away from screens, logging on paper keeps the whole ritual offline.
The honest trade-off: paper won't chart your pace or recommend your next book. You tally totals by hand. For readers who want simplicity over automation, that's a feature, not a bug.
Make it as pretty as an app
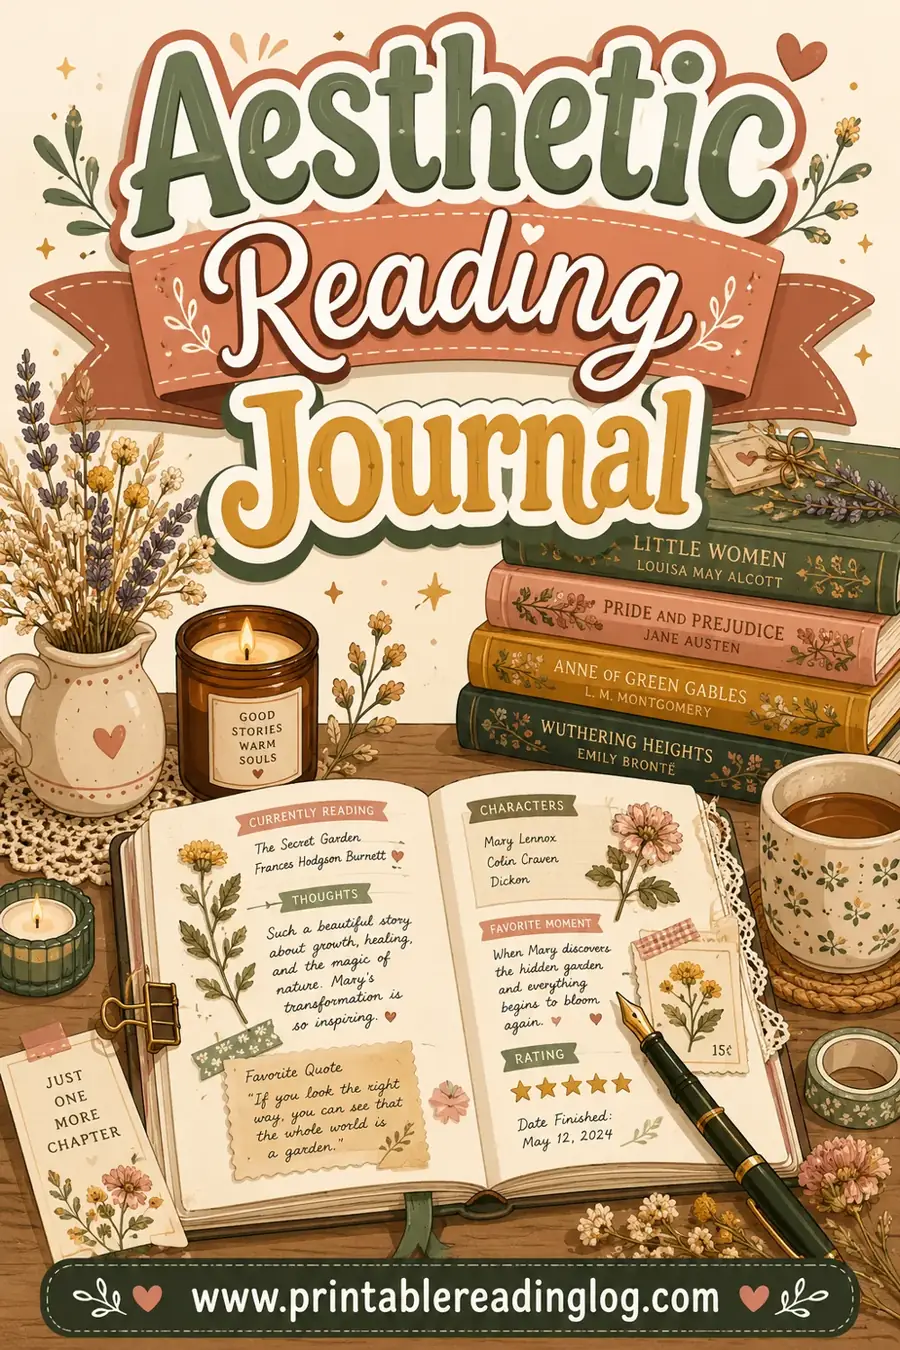
One thing people love about StoryGraph is the clean visuals. You can get that on paper too. An aesthetic reading journal layout, with star ratings, color-in progress bars, and space for a favorite line, looks lovely and is satisfying to fill in. Paper can be just as joyful as a dashboard.
A Sample Printable Log With StoryGraph-Style Details
Worried paper can't capture the good stuff StoryGraph shows? Here's a layout that records the same details readers love, by hand.
| Date | Title | Pages | Mood | Rating |
|---|---|---|---|---|
| 6/02 | The Night Circus | 40 | Magical | ★★★★★ |
| 6/04 | The Night Circus | 35 | Dreamy | ★★★★★ |
| 6/07 | Project Hail Mary | 50 | Tense | ★★★★☆ |
| 6/09 | Project Hail Mary | 45 | Hooked | ★★★★☆ |
| 6/12 | Beach Read | 30 | Cozy | ★★★★☆ |
The "Mood" and "Rating" columns mirror exactly what StoryGraph tracks automatically. The difference is you write them in, which some readers find more reflective and memorable than tapping a screen.
How to Decide Between Them
Run through these quick questions and the answer usually appears.
| If you... | Choose |
|---|---|
| Love automatic charts and stats | StoryGraph |
| Want your data to stay private | Printable log |
| Are tracking a young child's reading | Printable log |
| Want next-book recommendations | StoryGraph |
| Read to escape screens | Printable log |
| Want to customize every column | Printable log |
| Are coming from Goodreads with a big library | StoryGraph |
If you ticked boxes on both sides, you're not alone, which leads to the best answer of all.
Why Not Use Both?
Plenty of readers run StoryGraph and a printable log, because they cover different moments.
- StoryGraph holds your full library and year-end stats. It's your digital record and recommendation engine.
- A printable log lives on your desk for the daily ritual: jot the date, the pages, a one-line reaction. At week's end you can transfer finished books to the app.
This combo gives you the app's automation and paper's simplicity. The printable log keeps you logging consistently; the app turns that data into pretty charts. It's the best of both worlds.
How to Recreate StoryGraph's Best Features on Paper
People assume an app can do things paper can't, but most of StoryGraph's headline features come down to columns you choose and a little end-of-month math. Here's how to rebuild each one on a printed sheet, so you're not giving anything up by going analog.
| StoryGraph feature | How to do it on paper |
|---|---|
| Mood tracking | Add a "Mood" column and jot a word per session |
| Pace / speed | Add a "Pages" or "Minutes" column |
| Genre balance | Tag each book by genre, tally at month's end |
| Star ratings | A simple ★ column, fill in 1 to 5 |
| Reading goal | Number your rows toward a target at the top |
| Year in review | Keep your monthly sheets in a binder |
The only real difference is who does the counting. StoryGraph adds up your genres and pace automatically; on paper you spend five minutes at the end of the month tallying. For a lot of readers that small ritual is actually the appeal, because adding up your own year feels more like reflection than a notification. If you want the visual polish too, an aesthetic reading journal layout gives you color-in bars and rating stars that look every bit as satisfying as a dashboard.
Doing your own "year in review"
StoryGraph's year-end recap is a fan favorite, all those charts of how much and what you read. You can stage your own from a binder of monthly logs. Flip through, count your finished titles, add up your star ratings to find your average, and note your most-read genre. It takes maybe fifteen minutes in late December, and many readers find writing a short reflection by hand more meaningful than scrolling an auto-generated summary. The data is the same; the experience is warmer.
Which Reader Are You? A Quick Self-Check
Still on the fence? Picture how you actually read day to day, and the answer usually settles itself. Run through these short profiles and find the one that sounds most like you.
- The data lover. You'd genuinely enjoy a chart of your reading moods and a graph of your pace. You read mostly on a phone or e-reader. Go with StoryGraph, the automation is the whole joy for you.
- The screen-weary reader. You read partly to escape your phone, and opening an app to log a book feels like a chore that pulls you back in. A printable log keeps the ritual offline and calm.
- The parent. You're tracking a young child's nightly reading and need a signature line for homework. Paper wins easily, no six-year-old should be logging on a phone.
- The minimalist. You just want a clean record of what you read, nothing more. A printable books-finished sheet is faster to start and never asks you to update an app.
- The completist. You want stats and the tactile habit. Run both, the printed log for daily logging and StoryGraph for the year-end numbers.
There's no wrong answer here, only a fit. If two profiles sound like you, lean toward the hybrid setup above, it covers both instincts without forcing a choice.
Frequently Asked Questions
Is StoryGraph better than a printable reading log?
Neither is strictly better; they suit different needs. StoryGraph wins for automatic stats and recommendations, while a free printable reading log wins for privacy, kids, offline use, and total control. Choose based on whether you value automation or simplicity, or use both together.
Is StoryGraph free?
StoryGraph's core features are free, including book logging, a reading goal, and basic stats. A low-cost "Plus" tier adds deeper analysis. A printable reading log is completely free with no paid tier at all.
Which is better for kids, StoryGraph or a printable log?
A printable reading log is far better for kids. It gives them big rows to write in, a signature line for a parent, and no screen, which is ideal for nightly reading homework. StoryGraph is built for adult readers using a phone.
Can I track moods and ratings on a printable log?
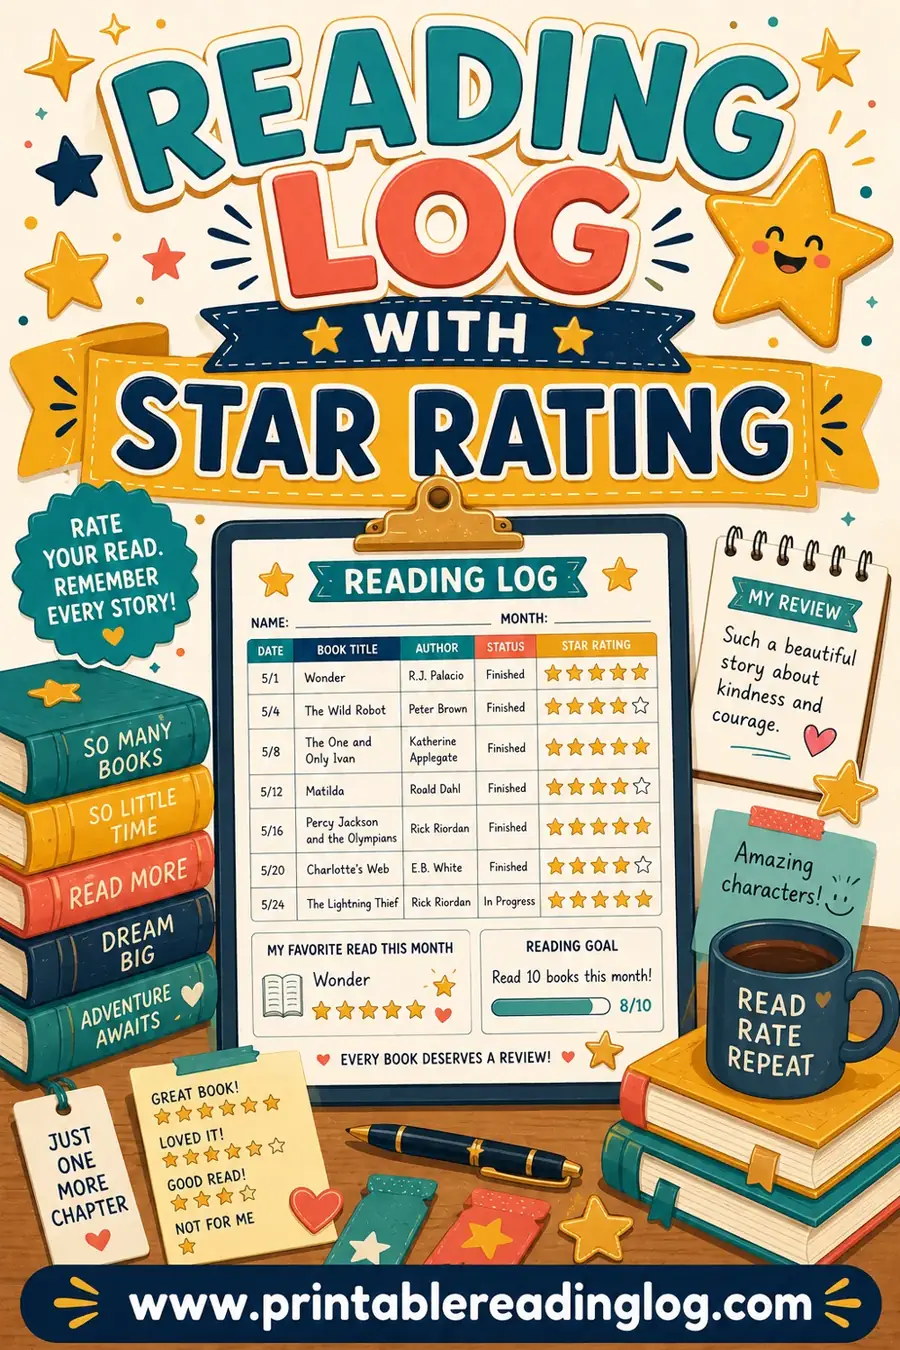
Yes. Just add "Mood" and "Rating" columns to your sheet, the same details StoryGraph records automatically. You fill them in by hand, which many readers find more reflective. The reading log with star rating guide shows a ready layout.
Can I use StoryGraph and a printable log at the same time?
Absolutely, and many readers do. Keep your full library and year-end stats in StoryGraph, and use a printed log on your desk for the daily habit of logging each session. They complement each other well.
Is a printable reading log really free?
Yes. You print it yourself at no cost, with no sign-up and no watermark. Print as many copies as you need, for yourself or a whole family.
Can I get a year-in-review from a printable log?
Yes, you just make it yourself. Keep your monthly sheets in a binder, then in December count your finished books, average your star ratings, and note your most-read genre. It takes about fifteen minutes and many readers find the hand-tallied recap more reflective than an automatic one.
Does StoryGraph work offline like a printable log?
Not reliably. StoryGraph needs a connection to sync and load your library, so a dropped signal or a dead battery can leave you unable to log. A printable sheet on the nightstand always works, which is why offline readers and travelers often keep one even if they also use the app.
Ready to Try the Printable Route?
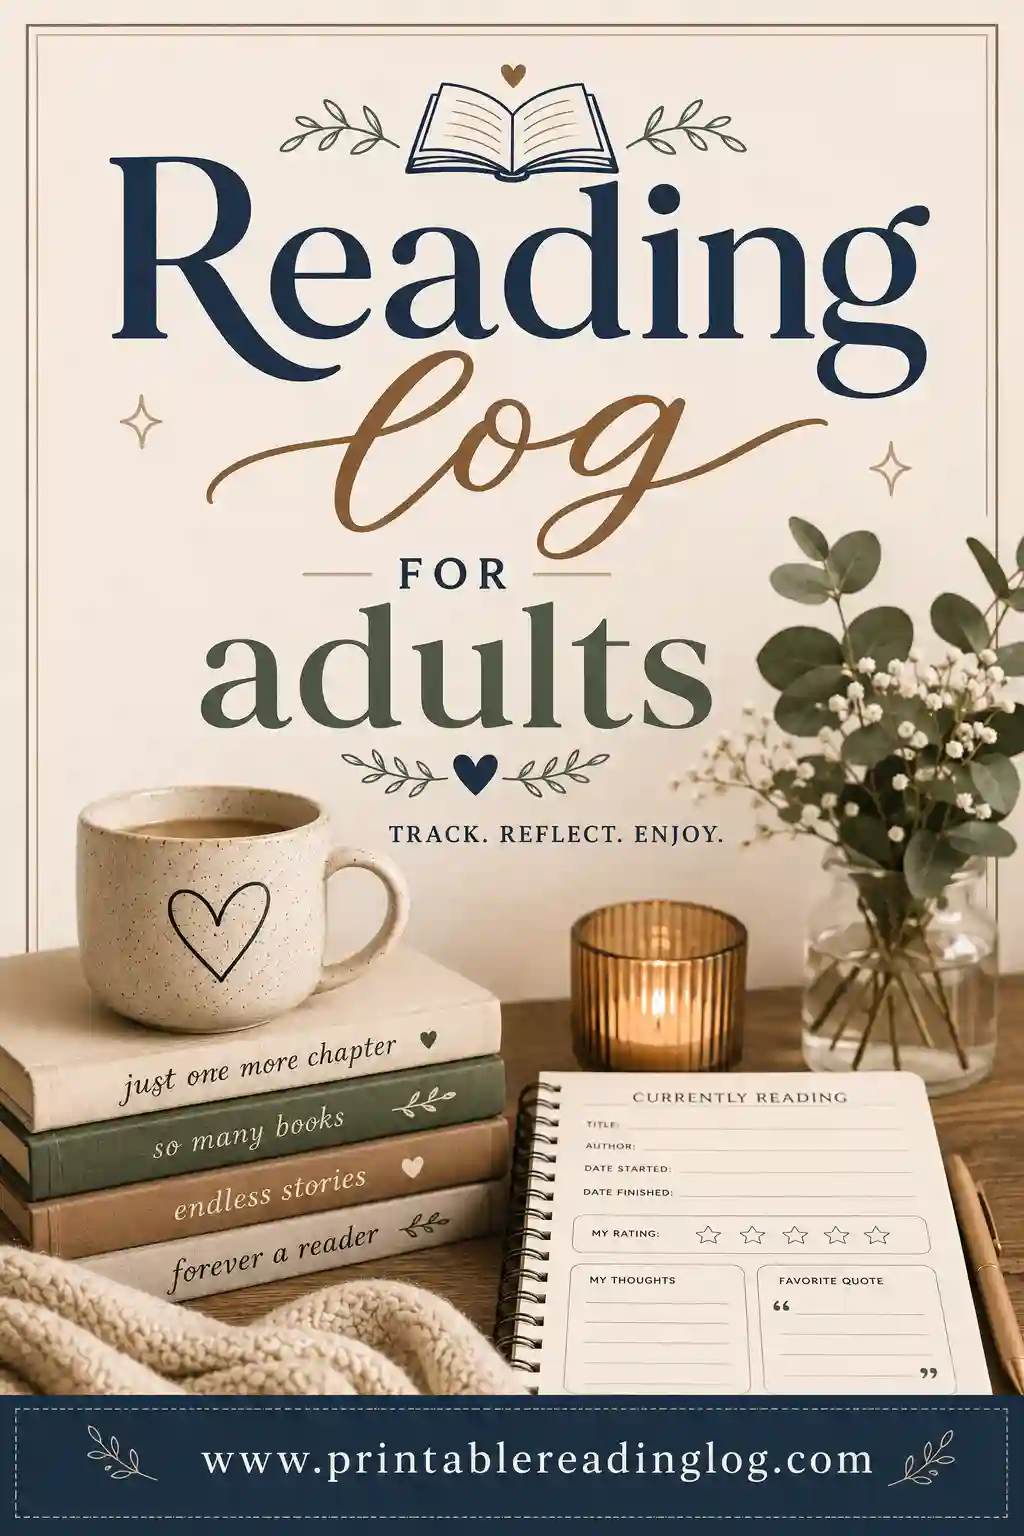
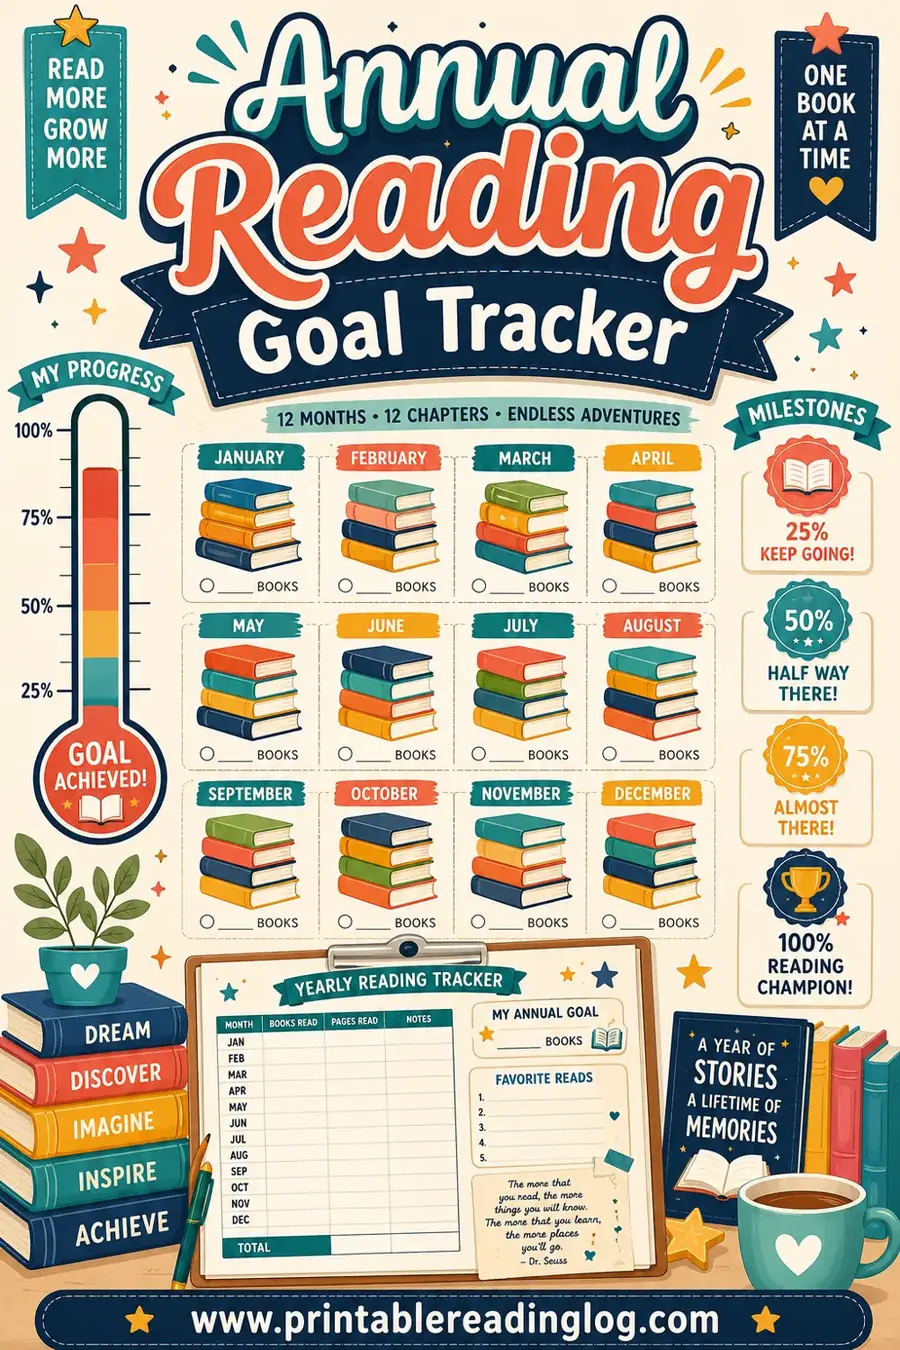
Whether you pair it with StoryGraph or use it on its own, a printable log is the simplest way to make your reading visible. Open the free reading log maker, choose your columns, and print a clean sheet that's private, offline, and entirely yours. For more, see our reading log for adults, reading log with star rating, and annual reading goal tracker guides. Start your first row tonight.